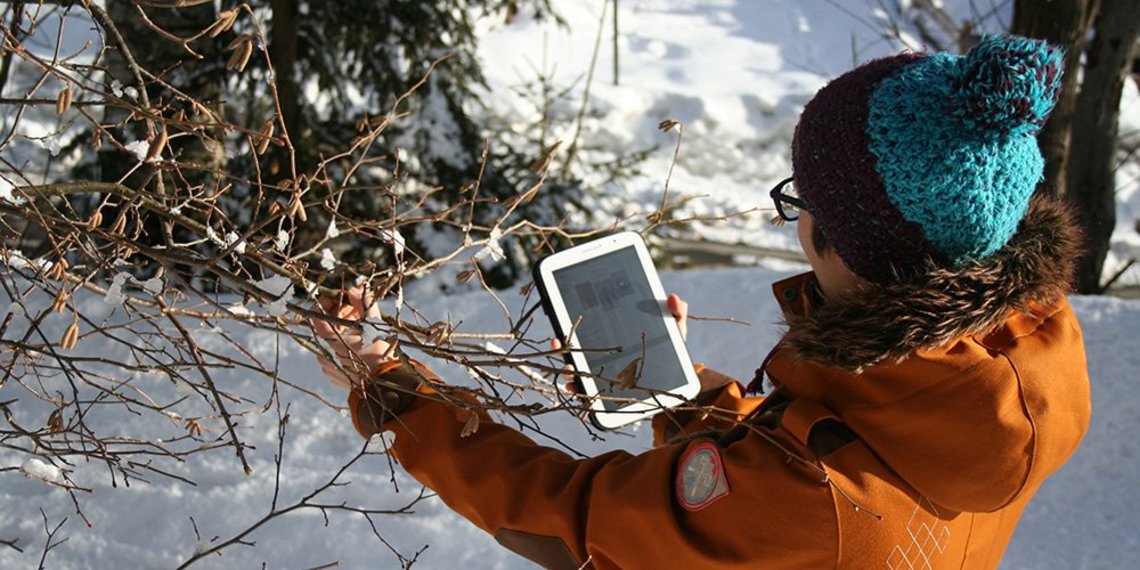
Follow the life of your trees throughout the seasons

Trees that live for several hundred years are not rare in the mountains. These trees, when they were born about a century ago, therefore experienced a climate that was about 2 degrees cooler than today. On an individual scale, trees and plants have no choice in adapting: once established, they must be able to adjust their responses to climatic conditions, not relying on displacement (like animals) but on their own genetics.
The Phénoclim programme was created in 2004 to better understand these responses through the evolution of their phenologies. The scientific questions are: what have been the shifts in seasonal events (such as flowering) over the past decades? How can we predict these shifts in the future? Are these shifts the same for all species, all altitudes, all mountain ranges? What are the consequences of these shifts (or lack of shifts) for the distribution of these species but also for the development of related species?
To answer these questions, the technology and the community of participants have been working together since the launch of the project. On the one hand, about a thousand participants (schoolchildren, individuals, protected areas, etc.) observe the appearance of seasonal events of 13 plant species around them. On the other hand, temperature and snow cover data are obtained in the vicinity of certain study trees thanks to a network of 60 climate stations managed by the CREA Mont-Blanc. Phénoclim is therefore the meeting of PHENOlogy and CLIMatology.

Target audience
Region
Season
Implementation time
About 15 minutes per week during observation periods
Naturalist difficulty
- Novice
- Naturalist
Involvement
The program requires regular monitoring from you
Species concerned
Access to study site
Equipment
binoculars (optional but recommended if the trees are big)
The protocol
1 Locate
Locate three trees/plants of the same species in the field. These three trees should be located close to each other (within 500m). Remember to choose a species from the 13 suggested opposite. You can of course follow several species. As you will be observing your trees on a weekly basis during the key stages, it is important to choose trees that are in a place where you regularly pass by, this could be your garden, a park next to your home, on your way to work or school...
Also, to recognize your trees and find them more easily the next time, you can tie a small string on one of these branches or add a discreet dot of paint.
2 Register your trees
Go to the Contribute page, click on "add a tree" in the Phénoclim section and position your trees on the map.
3 Observe
Once a week (preferably on the same day), go and observe your trees so as not to miss the start date of each of the stages described below. Start by getting an idea by looking at a single branch of the tree and then step back to look at the tree as a whole, this will help you refine your observation.
In spring
Budburst
The vegetative buds (those that produce leaves) begin to open and new leaves are visible at the tip of the bud; if about 10% of the tree's buds are open, note the date of your visit as the budburst date. If less than 10% of the buds are open, you will have to go back the following week. To guide you in the observation of this and the following stages, feel free to consult the species sheets available in the toolbox.
Foliage
The new leaves open completely, their petioles are visible and their shape is recognisable even if they have not yet reached their final size.
If about 10% of the new leaves are as described above, note the date of your visit as the leafing date. If less than 10% of the leaves have spread you will have to go back the following week.
Flowering
The petals are open enough to show the inside of the flower, if this is the case for about 10% of the flowers on the tree, note the date of your visit as the flowering date. If less than 10% of the flowers bloom, you will have to go back the following week.
The flowering period differs according to the species. For lilac, mountain ash and ash, observe the opening of the first flower of the inflorescence. An inflorescence is considered to be in flower when at least one flower of the inflorescence has opened. For hazel, birch, spruce, Norway spruce, beech, Scots pine and larch, the flowering stage corresponds to the release of pollen from the male flowers (catkins).
If you are looking at herbaceous plants such as primrose and coltsfoot, these should be in a square of about 4x4m or about 20m². From the moment when 10% of the flowers have bloomed in the observed square, you can note your observation.
NB: It can happen that in some years the flowering does not take place for certain tree species. In this case, you can specify this when you enter the data. To observe the absence of a phenomenon is also to observe something!
In autumn
Change in colour of the leaves
The observation of colour change in autumn does not concern all 13 species. You should only do this if you are following silver birch, downy birch, beech, larch or mountain ash.
Another specificity of the autumn observation is that you should observe the beginning of the colour change (the usual 10%) but also half of the colour change (50%). You will therefore have two dates to note.
The leaves on your tree have started to change colour and you have about 10% that are now light green/yellow. Note the date of your visit for this phenological stage. Continue your weekly rounds until 50% of the leaves are in the same condition. It will then be time to note the date of the last stage of the year.
NB: yellowing of the leaves is often concomitant with the fall of part of the tree's leaves. If a leaf has fallen off the tree then it is considered to have turned yellow. So if 40% of the leaves on the tree are yellow, but about 10% of the leaves on the tree have fallen to the ground, then I estimate that the 50% leaf colour change has been reached. The senescence of the leaves of a single tree can take a long time and its progress is not always easy to estimate so do your best!
4 Send
Once you have completed your tour, complete your field sheet and remember to report your observations to SPOT before the end of the season, or enter your observations directly into SPOT from your smartphone or computer when you return. To do this, go to the "Observations" map and click on "Add an observation" in the programme section.
Practical advice
- In order not to miss your weekly appointment, you can activate a reminder request, so that a notification will be sent to you every week. Once you have created your trees, you will find an indication of when to look for the different stages on each tree page.
- If you observe about 20%, 30%, or even 50% during your visit, you can estimate the likely date for the 10% by looking at the date of your last visit. For example, if you pass on a Tuesday and estimate that 25% of the buds are open and the previous Tuesday only 5% were open, you can estimate that the 10% was reached around the previous Friday. Please note: this estimate will only be possible if you have visited your tree the week before.
- As memory sometimes plays tricks on us, remember to take photos of your trees during your weekly visits so that you can compare the evolution of your tree with the previous visit.
- If you have been using the field sheet to record your weekly observations, please feel free to use the multiple entry option to send us your data on SPOT. This will allow you to enter several observations at once.
- If you live far from a mountain range, an equivalent of Phénoclim exists: Observatory of Seasons.
Toolbox
Phénoclim toolbox
Autres ressources utiles
Become a Phénoclim relay
If you wish to relay the Phénoclim programme, please find below a document explaining the process and containing some advice on how to set up a community of observers. Feel free to consult it and then contact us to set up this partnership.
Do not hesitate to consult it and contact us at spot@creamontblanc.org to set up this partnership.
Speciessheets
Results
Phénoclim is a program that produces scientific publications as well as indicators of seasonal trends.
- Bison, M., Yoccoz, N. G., Carlson, B. Z., & Delestrade, A. (2019). Comparison of budburst phenology trends and precision among participants in a citizen science program. International Journal of Biometeorology, 63(1), 61-72.
- Asse, D., Randin, C. F., Bonhomme, M., Delestrade, A., & Chuine, I. (2020). Process-based models outcompete correlative models in projecting spring phenology of trees in a future warmer climate. Agricultural and Forest Meteorology, 285, 107931.
- Asse, D., Chuine, I., Vitasse, Y., Yoccoz, N. G., Delpierre, N., Badeau, V., ... & Randin, C. F. (2018). Warmer winters reduce the advance of tree spring phenology induced by warmer springs in the Alps. Agricultural and Forest Meteorology, 252, 220-230.
- Pellerin, M., Delestrade, A., Mathieu, G., Rigault, O., & Yoccoz, N. G. (2012). Spring tree phenology in the Alps: effects of air temperature, altitude and local topography. European Journal of Forest Research, 131(6), 1957-1965.
- Laigle, I., Carlson, B. Z., Delestrade, A., Bison, M., Van Reeth, C., & Yoccoz, N. G. (2022). In-situ Temperature Stations Elucidate Species’ Phenological Responses to Climate in the Alps, but Meteorological and Snow Reanalysis Facilitates Broad Scale and Long-Term Studies. Frontiers in Earth Science, 10, 912048.


